By Saskia | January 16, 2019
Last updated: May 01, 2019
If you are an R user but don’t know yet what Shiny and Shiny apps are, you definitely should read up on it on https://shiny.rstudio.com.
But in a nutshell, Shiny is an R package that builds interactive web apps straight from R. You just need to write an R script that follows a specific Shiny syntax and once you run the script, the package builds a HTML file as user interface (UI) with interactive input elements (based on Javascript) that trigger certain computations in R. The output of theses computations can be then shown as output in the UI. You can easily extend your Shiny apps with CSS themes, htmlwidgets, and JavaScript actions. Since you need to run R in the background you can either launch a Shiny app directly in your R Studio IDE or host it on a website that is connected to a Shiny server (e.g. R Studio hosts the cloud service www.shinyapps.io, where you can deploy your app).
Shiny apps can be very helpful to make statistical concepts and theories more accessible and I started to use it more and more in my stats courses at the university. I’ve even started to set up my own Shiny Server using DigitalOcean (see my recent post on that: Run shiny server on your own DigitalOcean droplet):
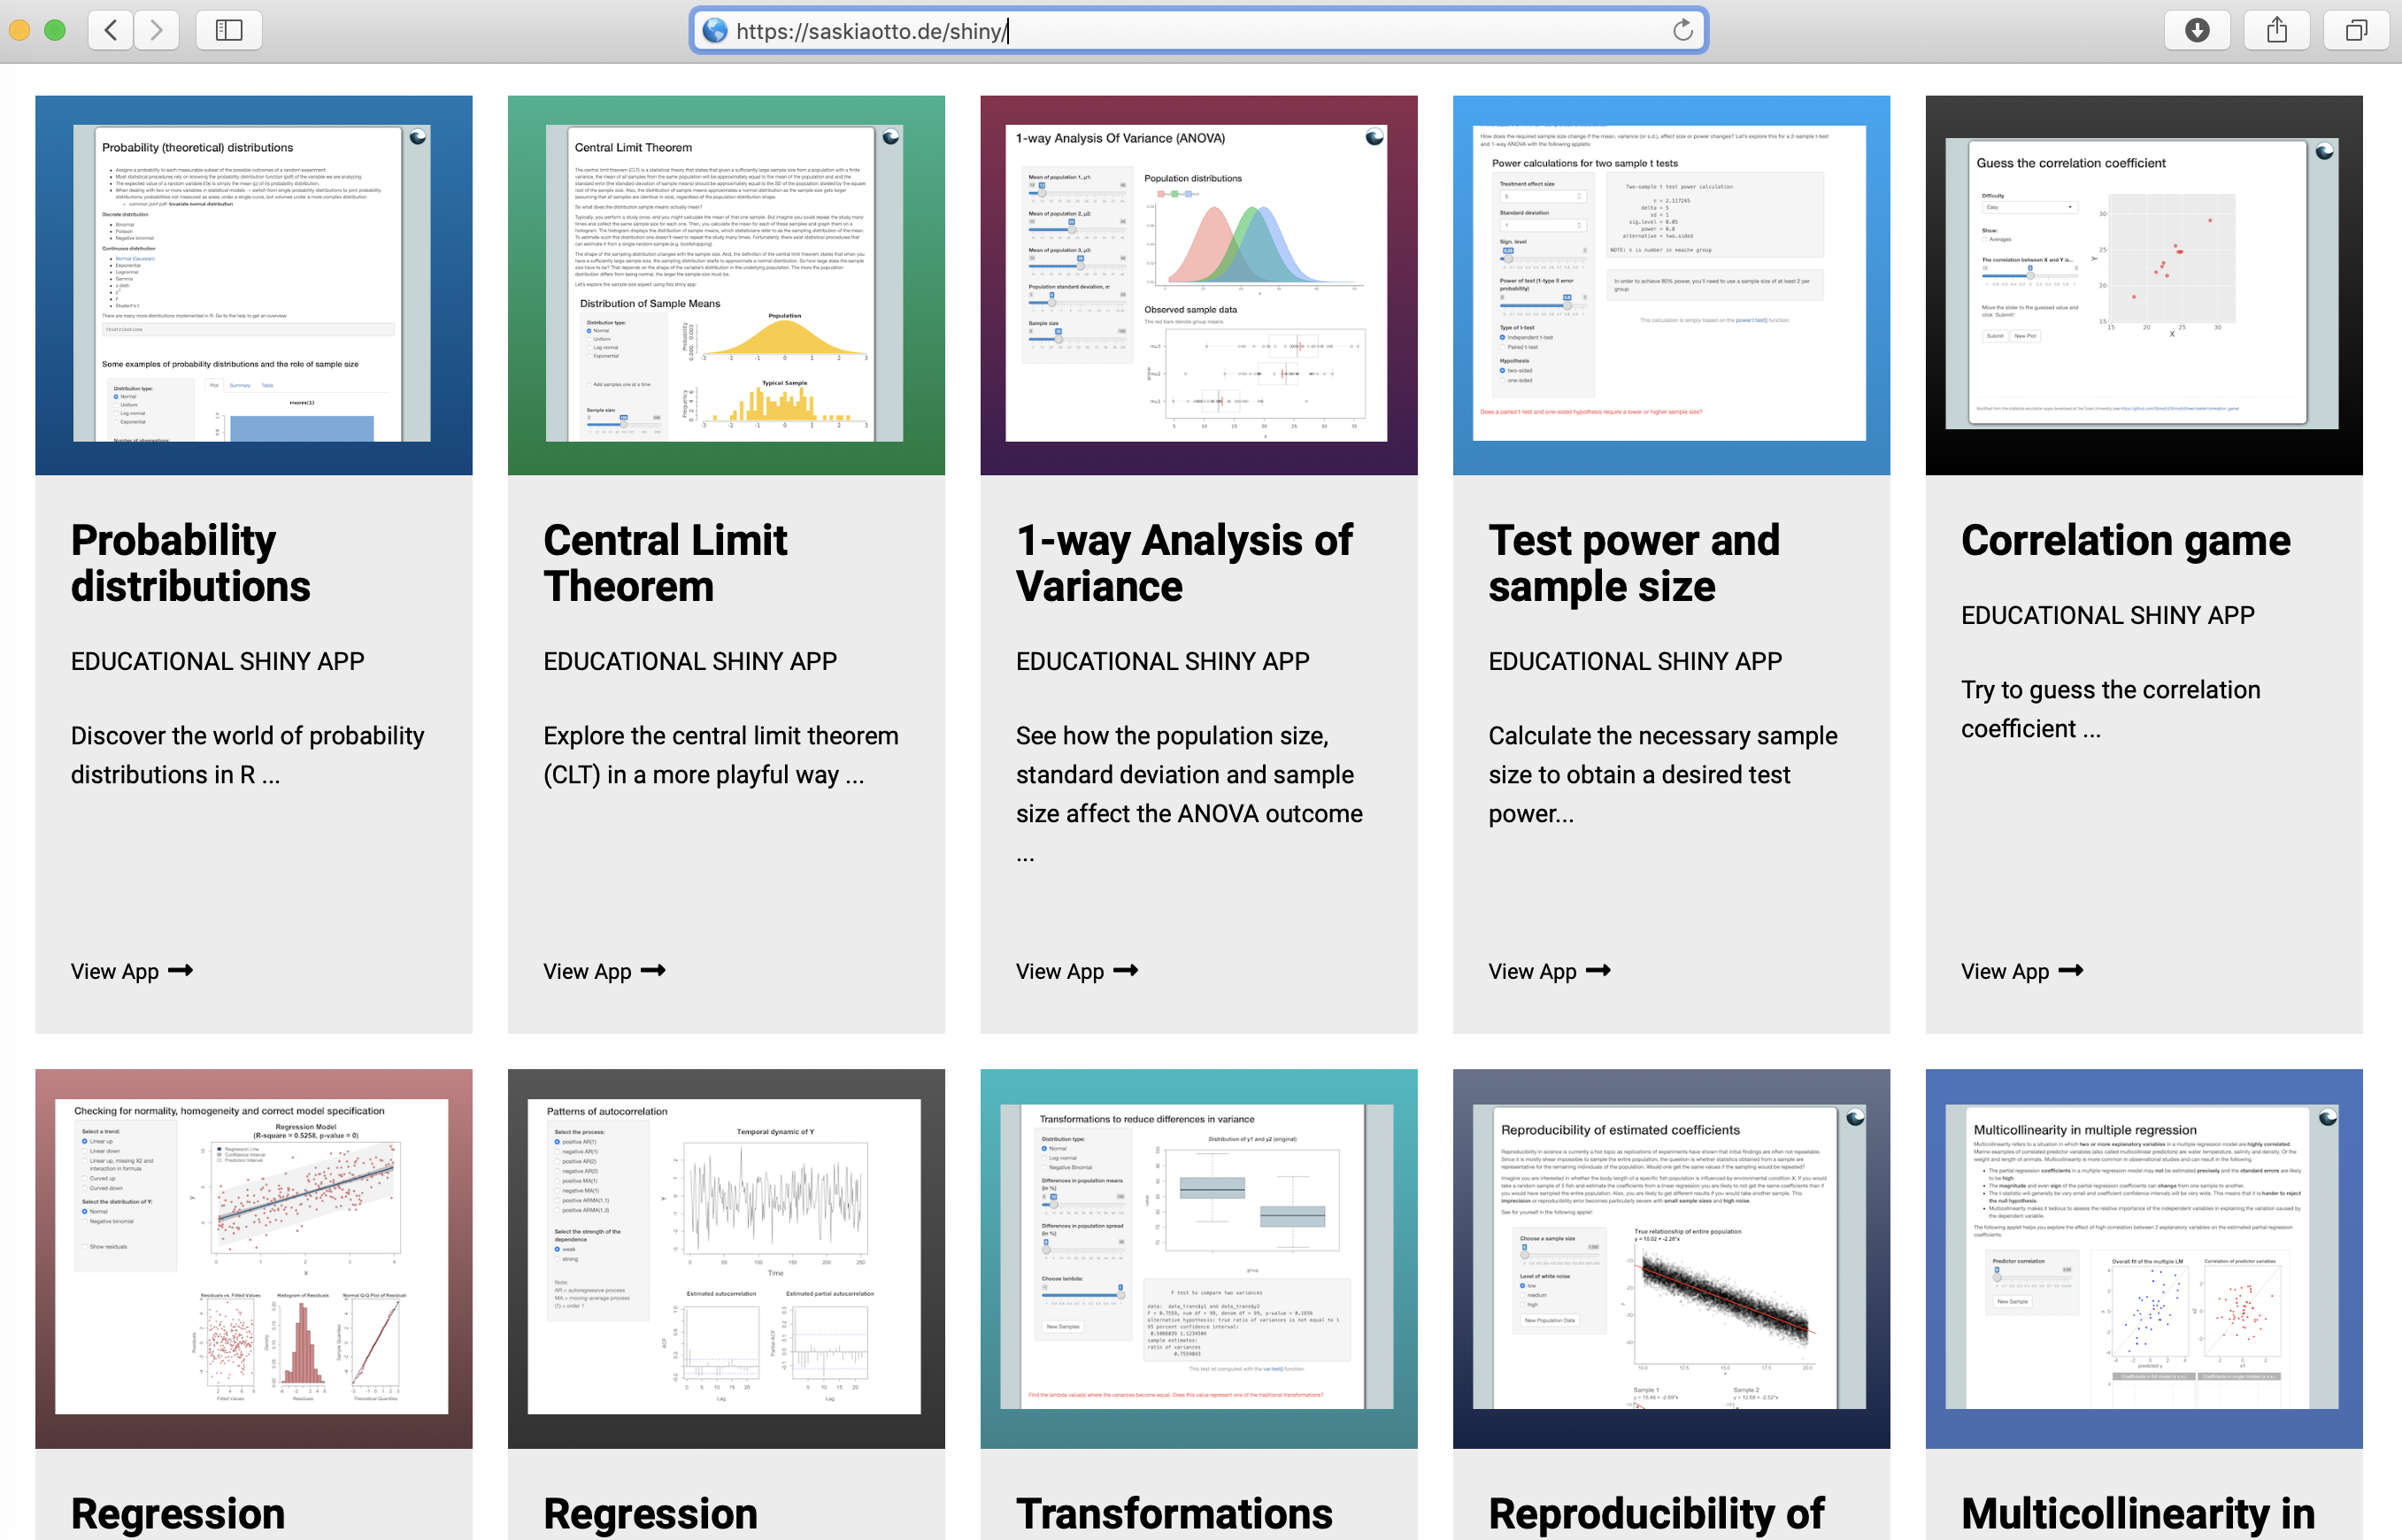
Link: https://saskiaotto.de/shiny
The Shiny website has also a big gallery of apps you can explore. Here are some examples linked to marine science that are worth playing around with. I embedded the websites of the Shiny app (if they are served over a secure HTTPS connection) so you can play around with them straight from here: simply move your cursor inside the app frame and scroll -vertically, but also horizontally- to see more of the app.
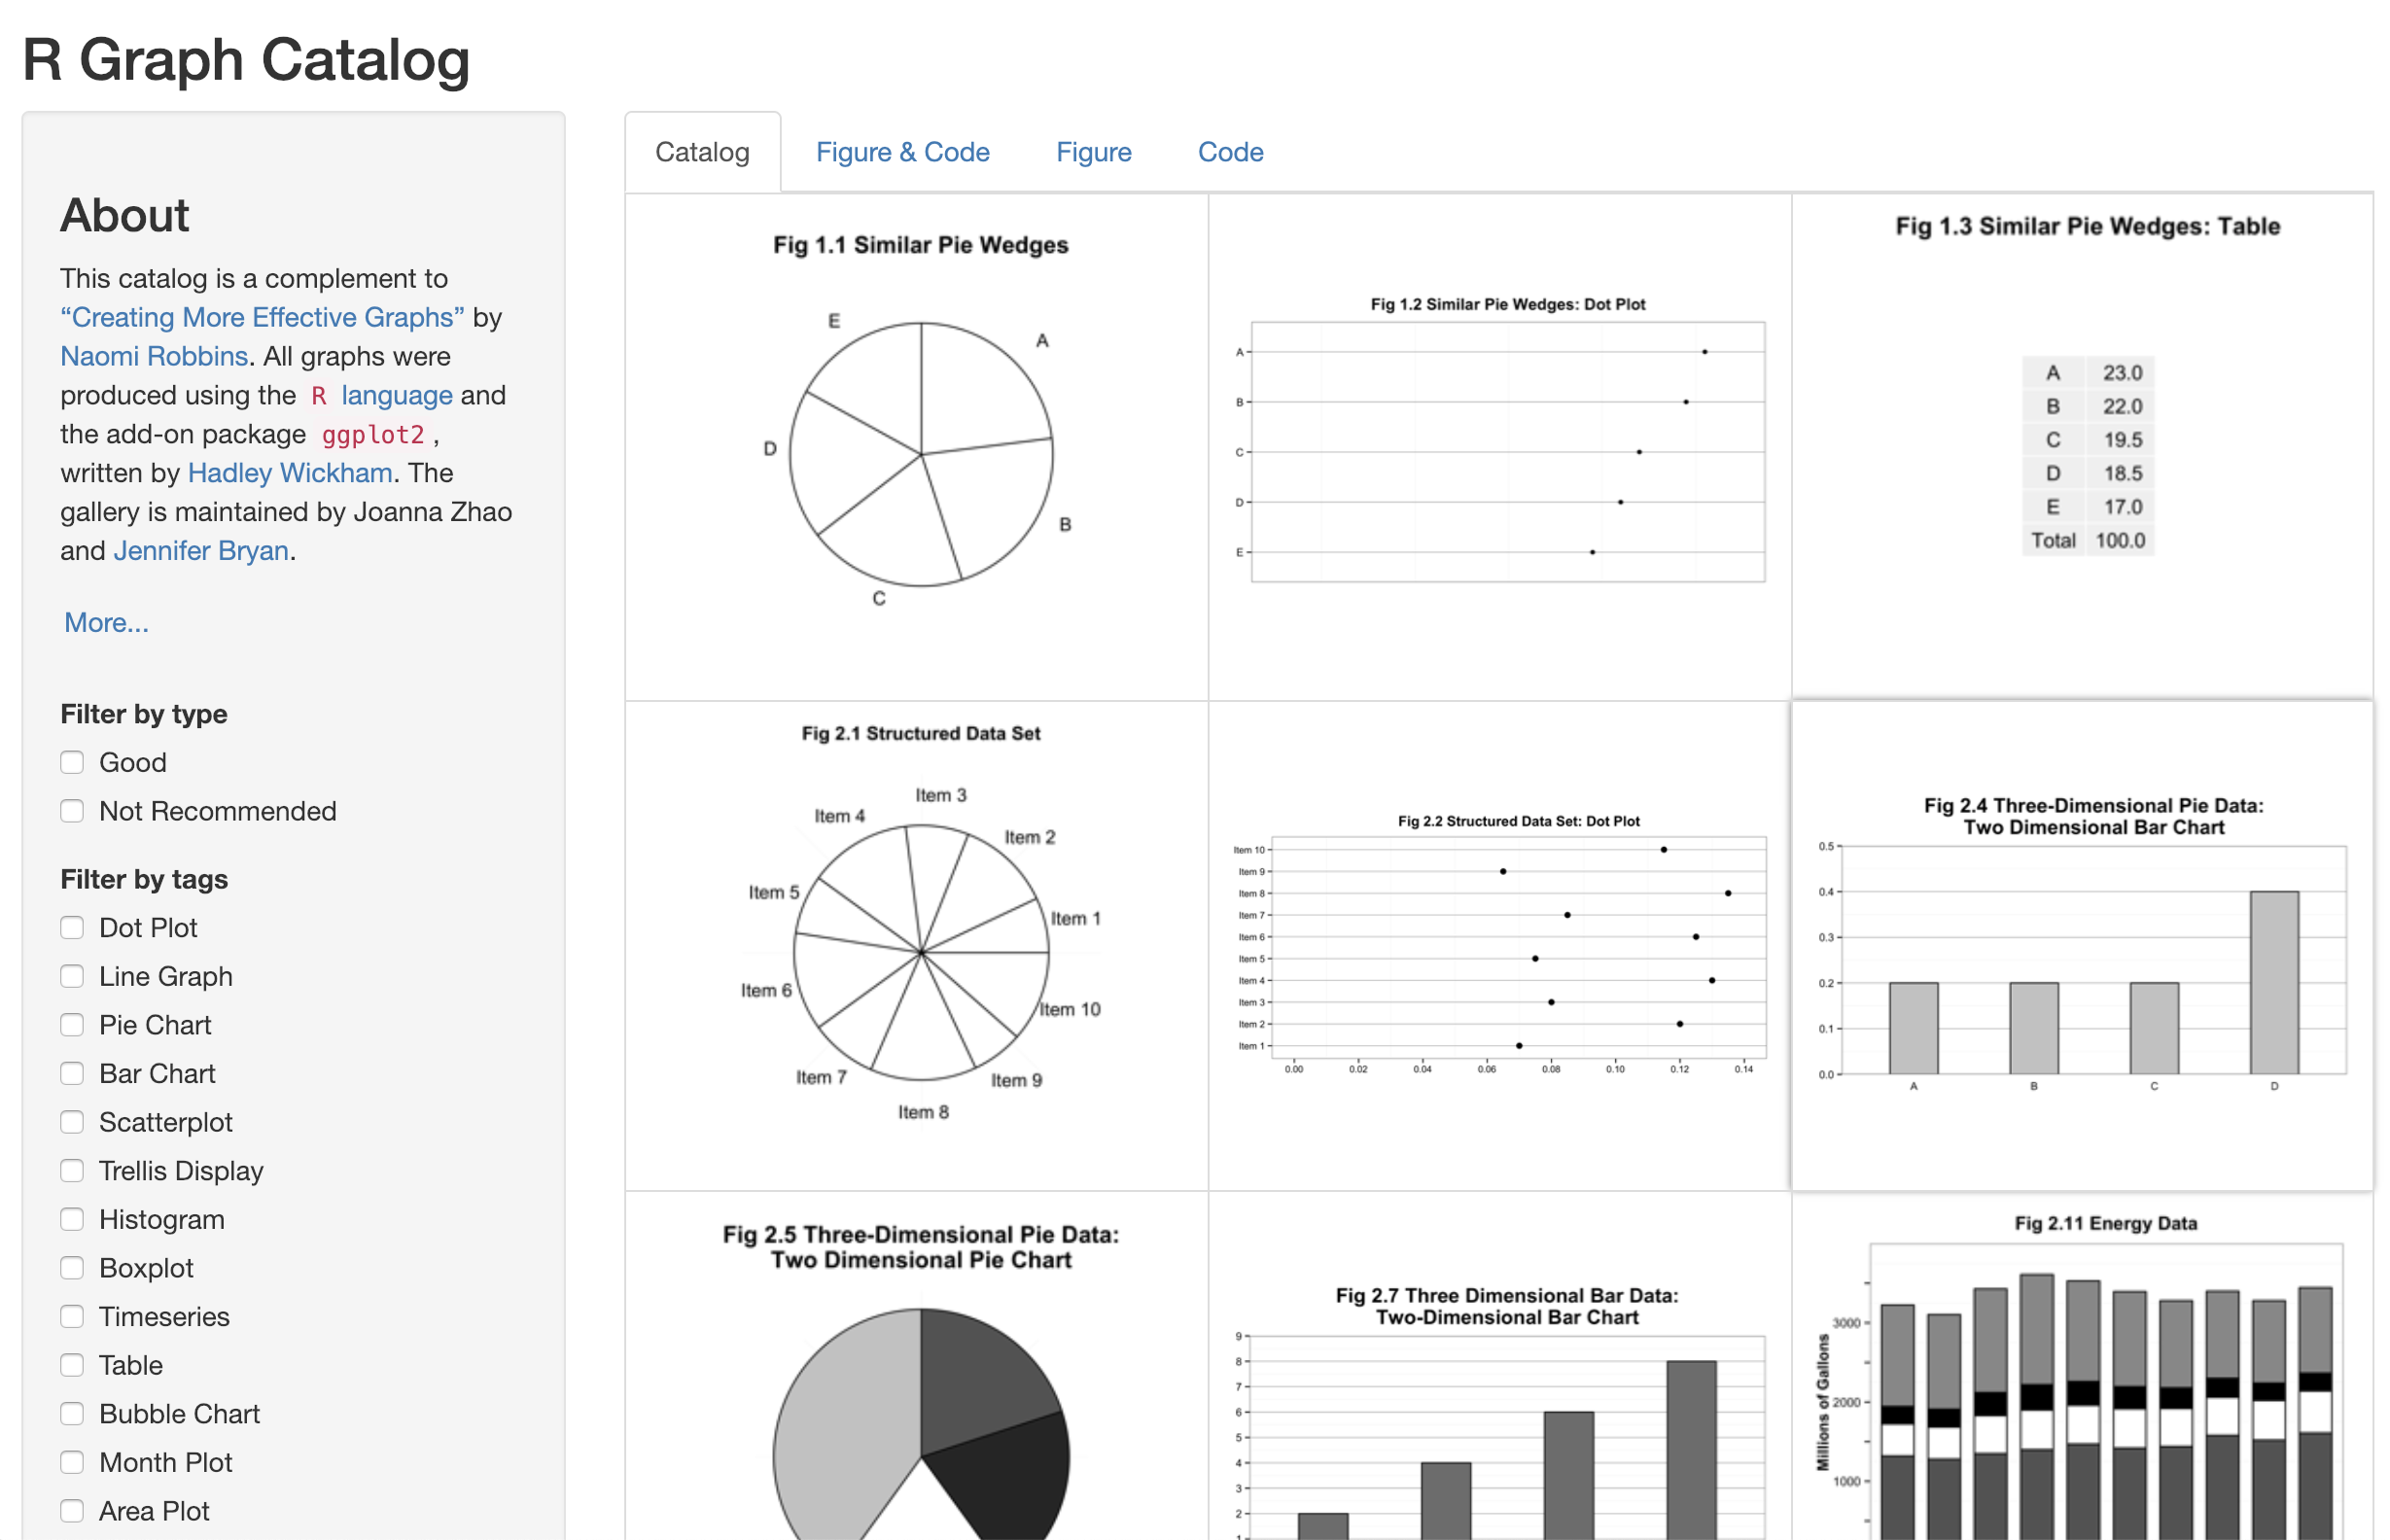
ggplot catalogue as Shiny app
This is a nice app that provides a catalog of different ggplots as a complement to the book Creating More Effective Graphs by Naomi Robbins and is maintained by Joanna Zhao and Jennifer Bryan.
You can filter for plot types you are interested in, then select the one you like best and see the R code to reproduce this graph:
3D Network Mapper
With this app you can visualize networks exported from NodeXL in a 3 dimensional view. NodeXL is a free Excel add-in that supports network and content analysis. You could, for instance, built a socio-ecological network with NodeXL and then load your .xlsx file into the app for 3D visualization. If you don’t have any data yet, try out the demo:
USGS Shiny app to inform stakeholder
This Shiny app written by Taylor Stewart from USGS (U.S. Geological Survey) is a good example of how to communicate science to fisheries managers, the fishing industry and the public in a more interactive way. The app serves as tool to explore trawl survey data taken by the Lake Erie Biological Station. Scroll down to see the actual app:
Link: https://gallery.shinyapps.io/lake_erie_fisheries_stock_assessment_app/
But NOTE: The current web location for this tool is temporary and it will be hosted on a USGS server at some point.
Modelling apps by the NIOZ Department of Estuarine & Delta Systems
The Department of Estuarine & Delta Systems, which is part of the Royal Netherlands Institute for Sea Research (NIOZ), has developed various R packages for marine data (checkout their R website: http://www.rforscience.com) and also a few interesting Shiny apps to demonstrate their modelling work. They are worth exploring if you work or study these fields but also to learn what one can do with R and Shiny apps (well, sometimes the code is written in Fortran to be faster…). Unfortunately, the website is not served through HTTPS so if you want to play around with them go on the weblinks below:
OMEXDIA - a biogeochemical model of the sediment
The first model example is a vertically resolved biogeochemical model (one of the first ones), which describes the cycle of oxygen, nitrogen, and carbon in marine sediments. The model comprises of 600 nonlinear equations, so bear in mind that each time you alter the value of a parameter, a quite substantial mathematical problem is solved.
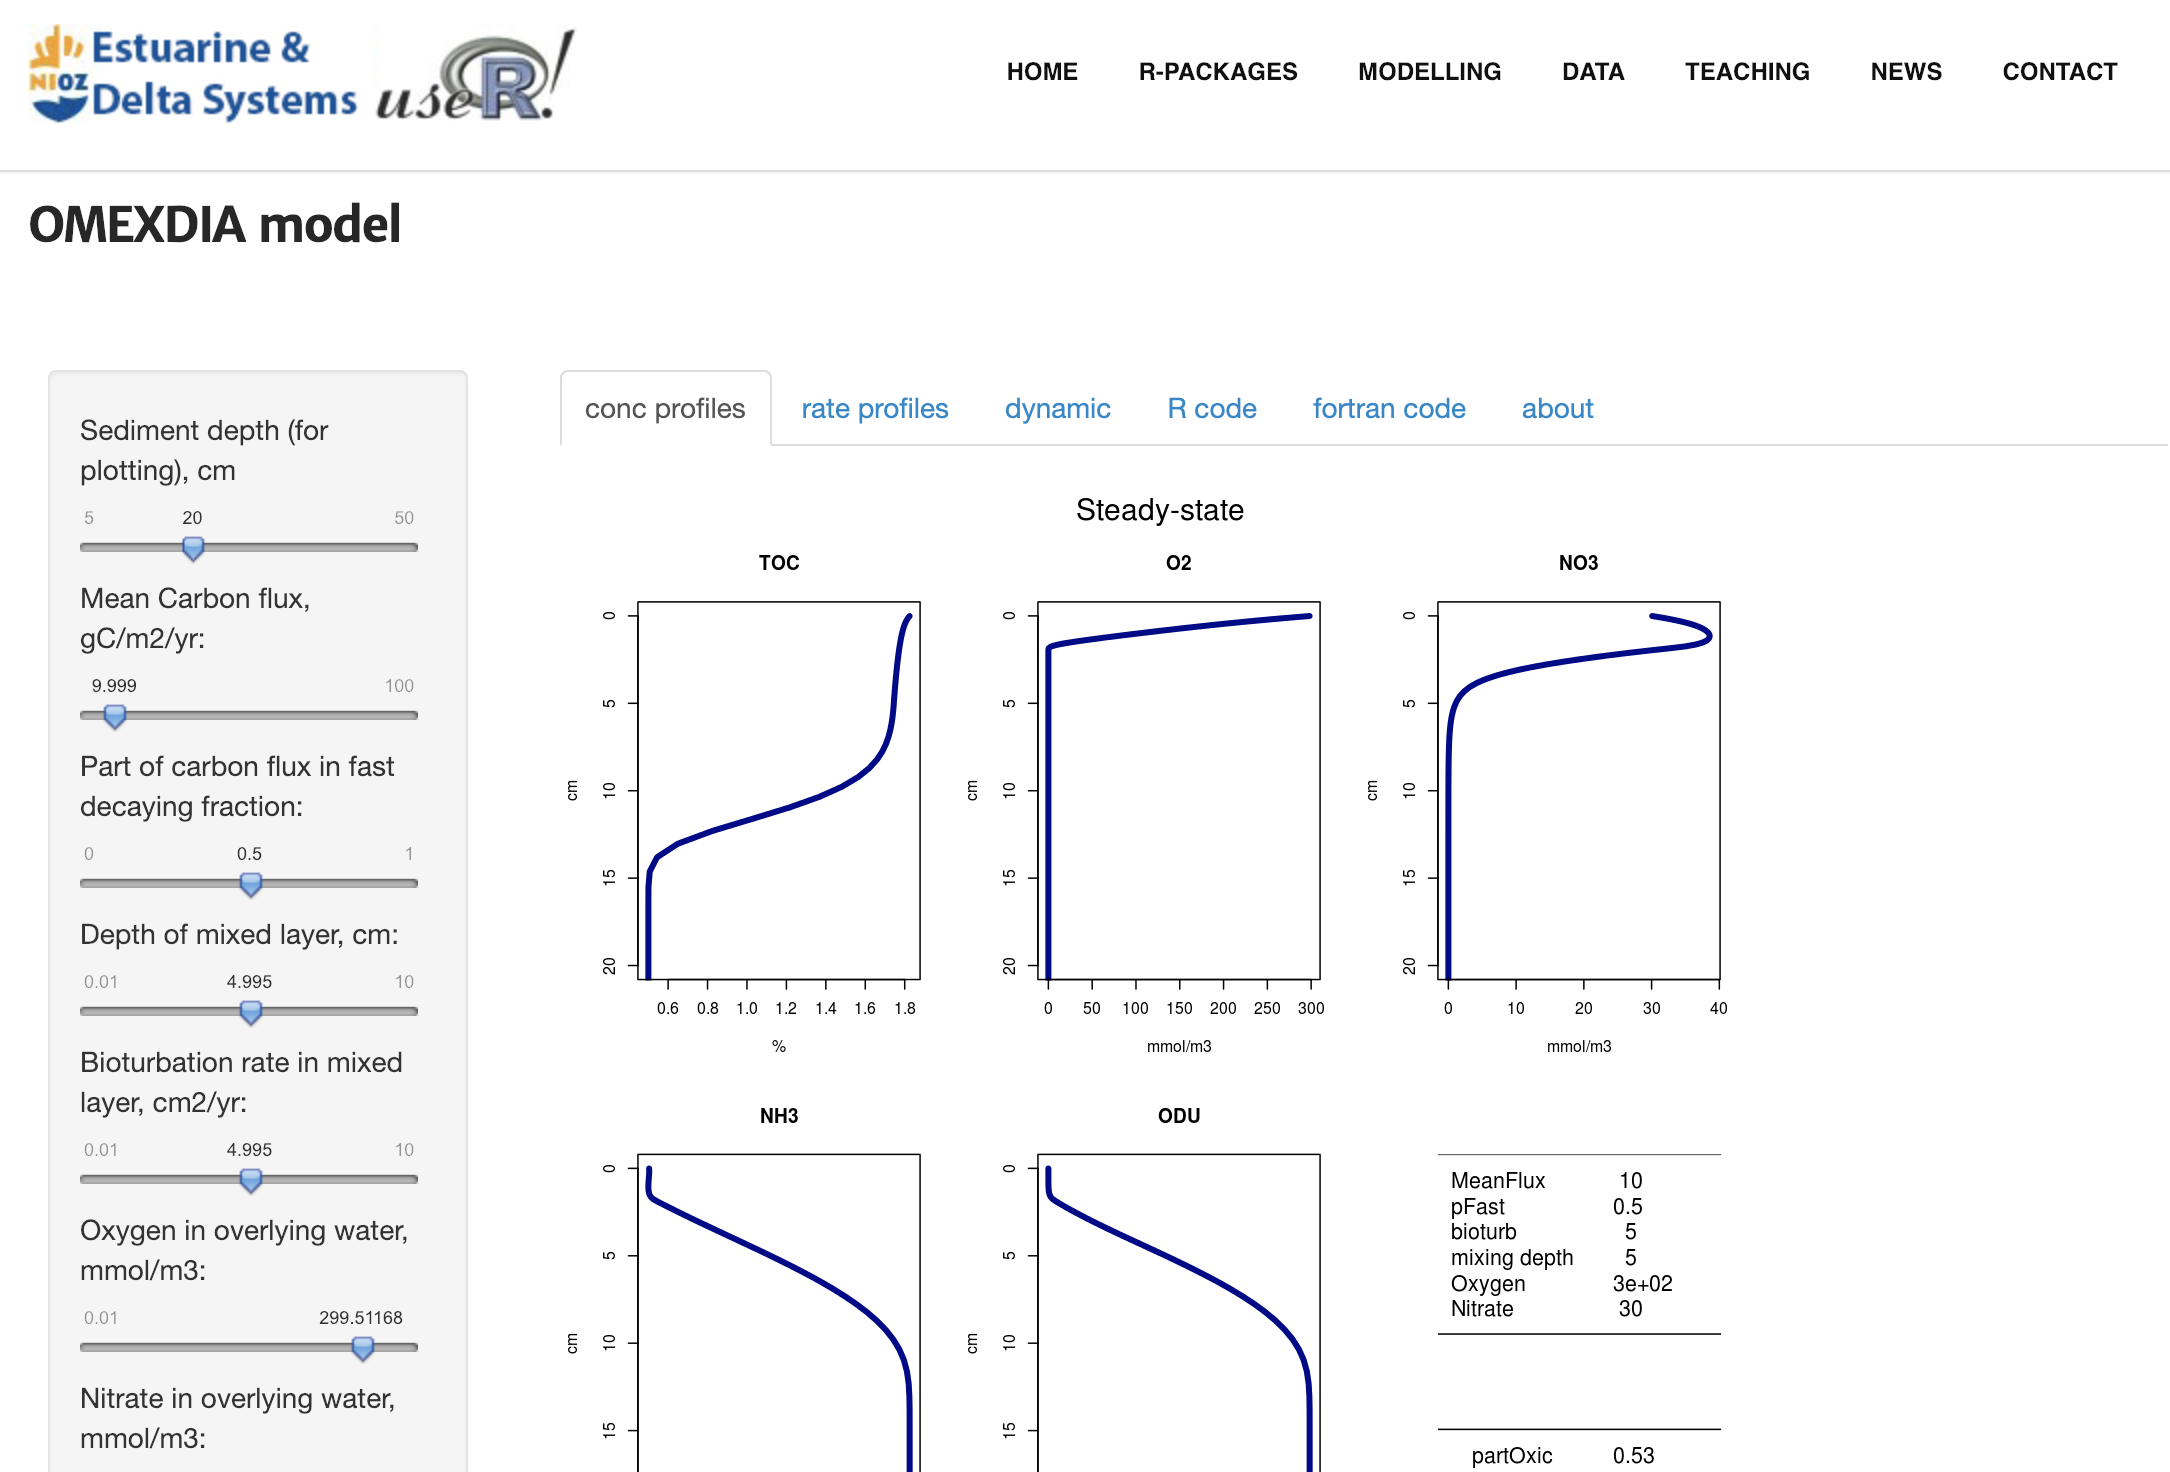
Link: http://www.rforscience.com/modelling/omexdia/
Coded by: Karline Soetaert
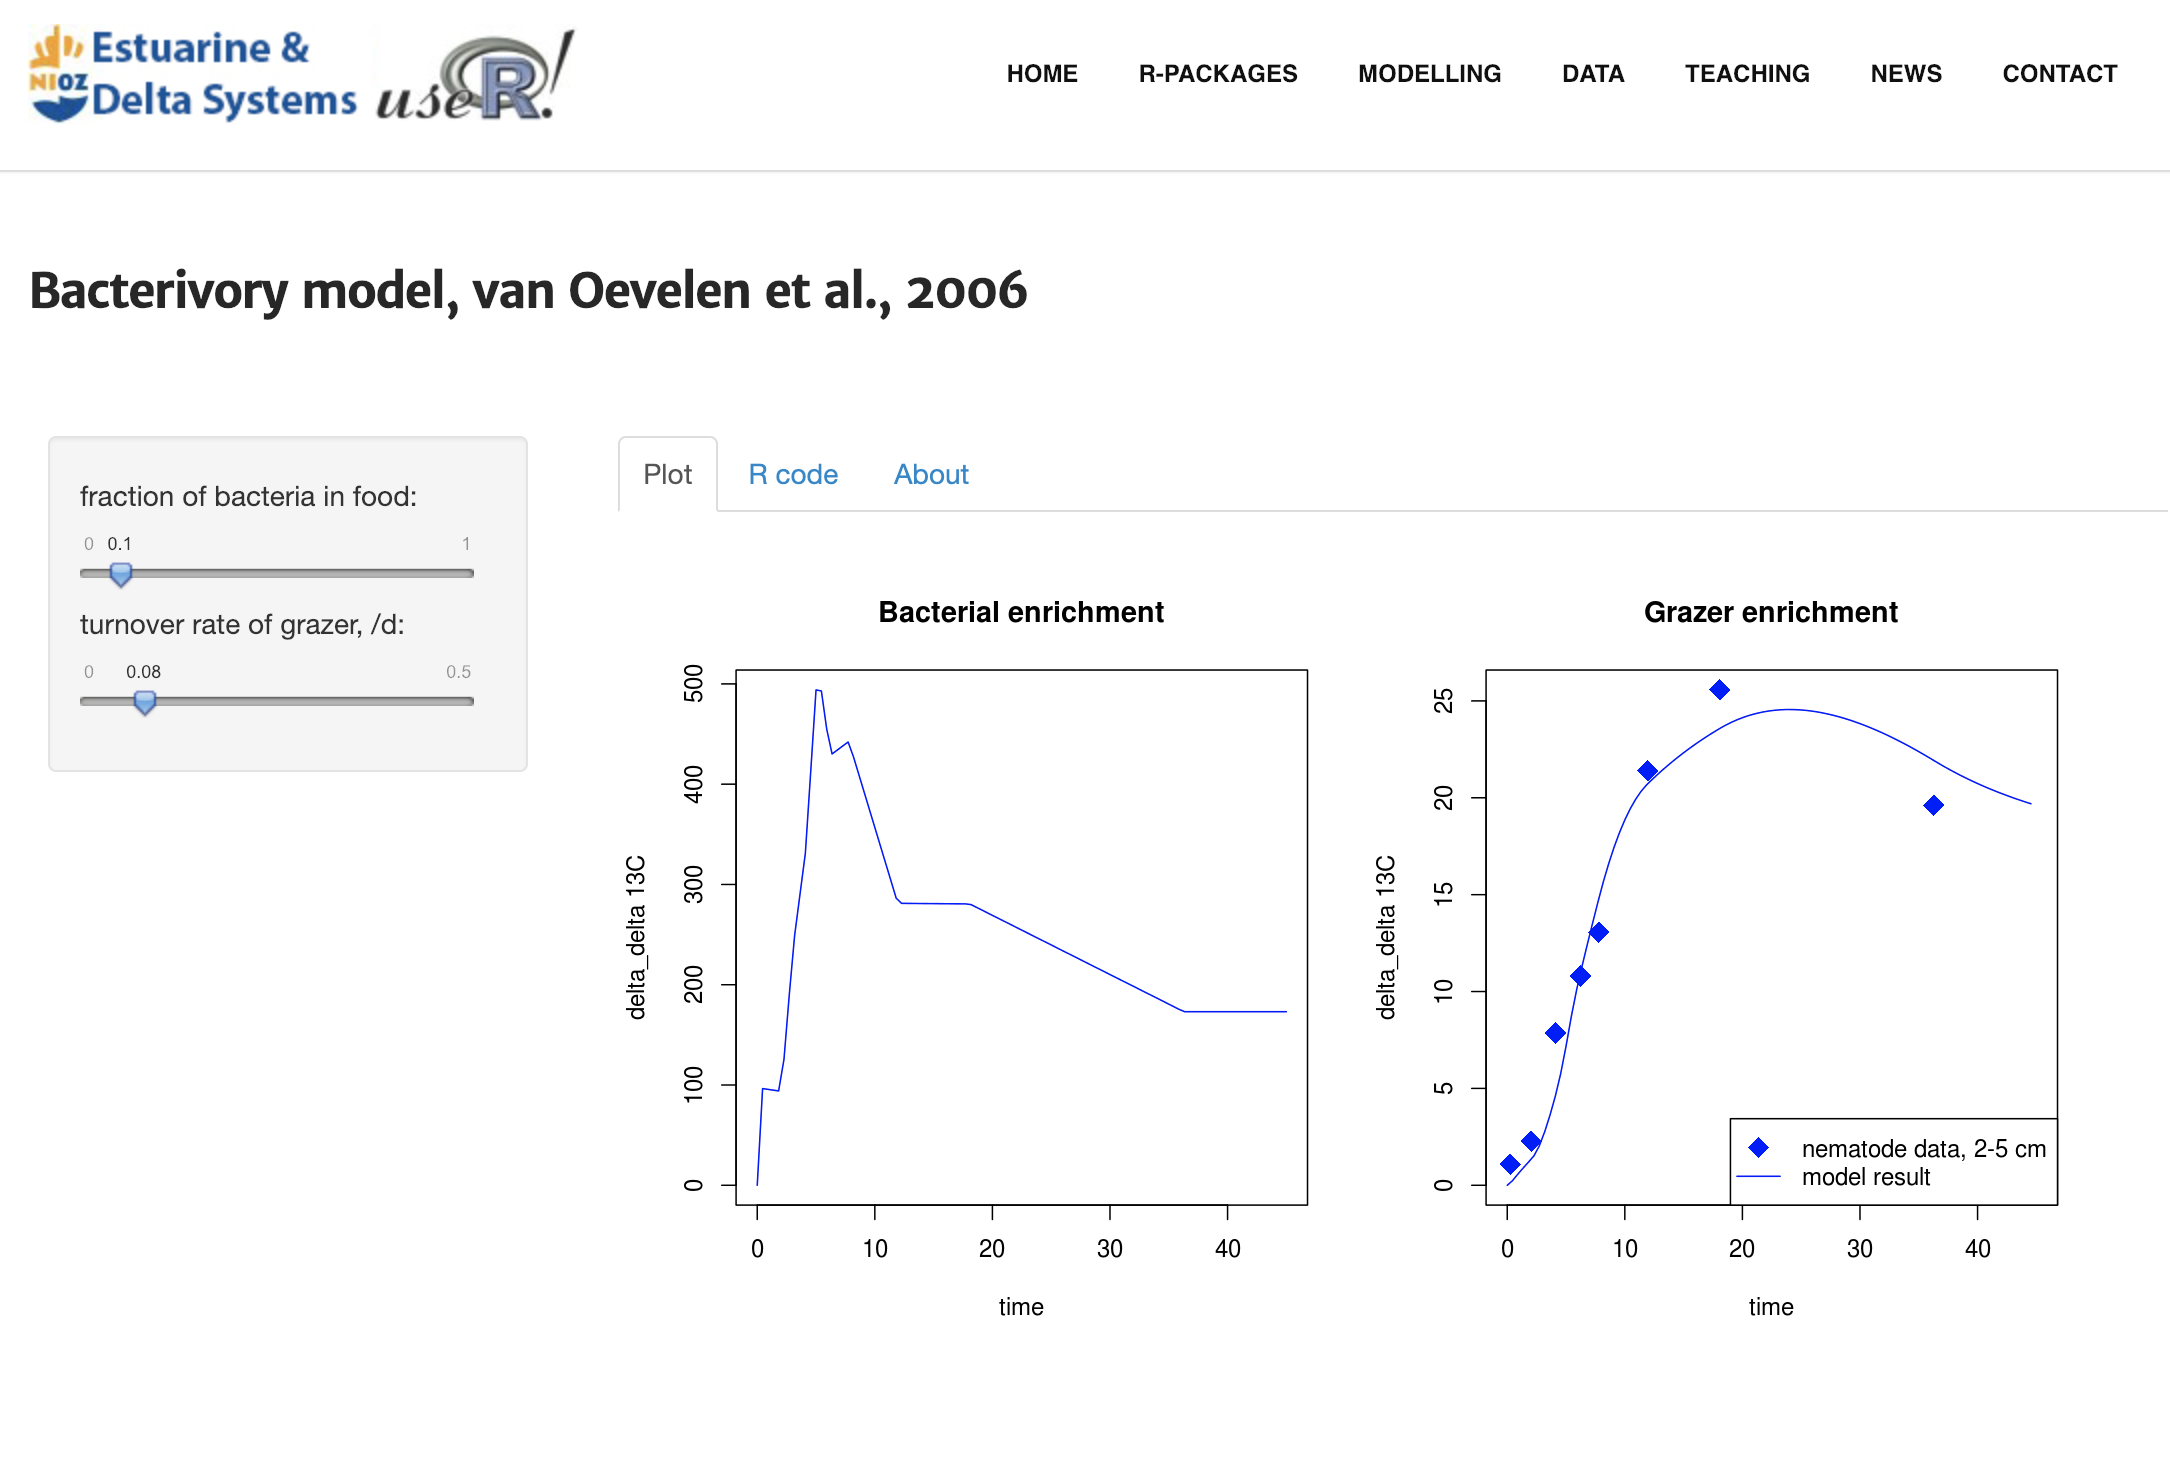
Tracer model
This app implements a simplified version of a bacterivory model that describes how a tracer, injected as labeled glucose, propagates through a food web. Such simple models are efficient tools to quantify how much a certain organism relies on a particular food source (here bacteria):
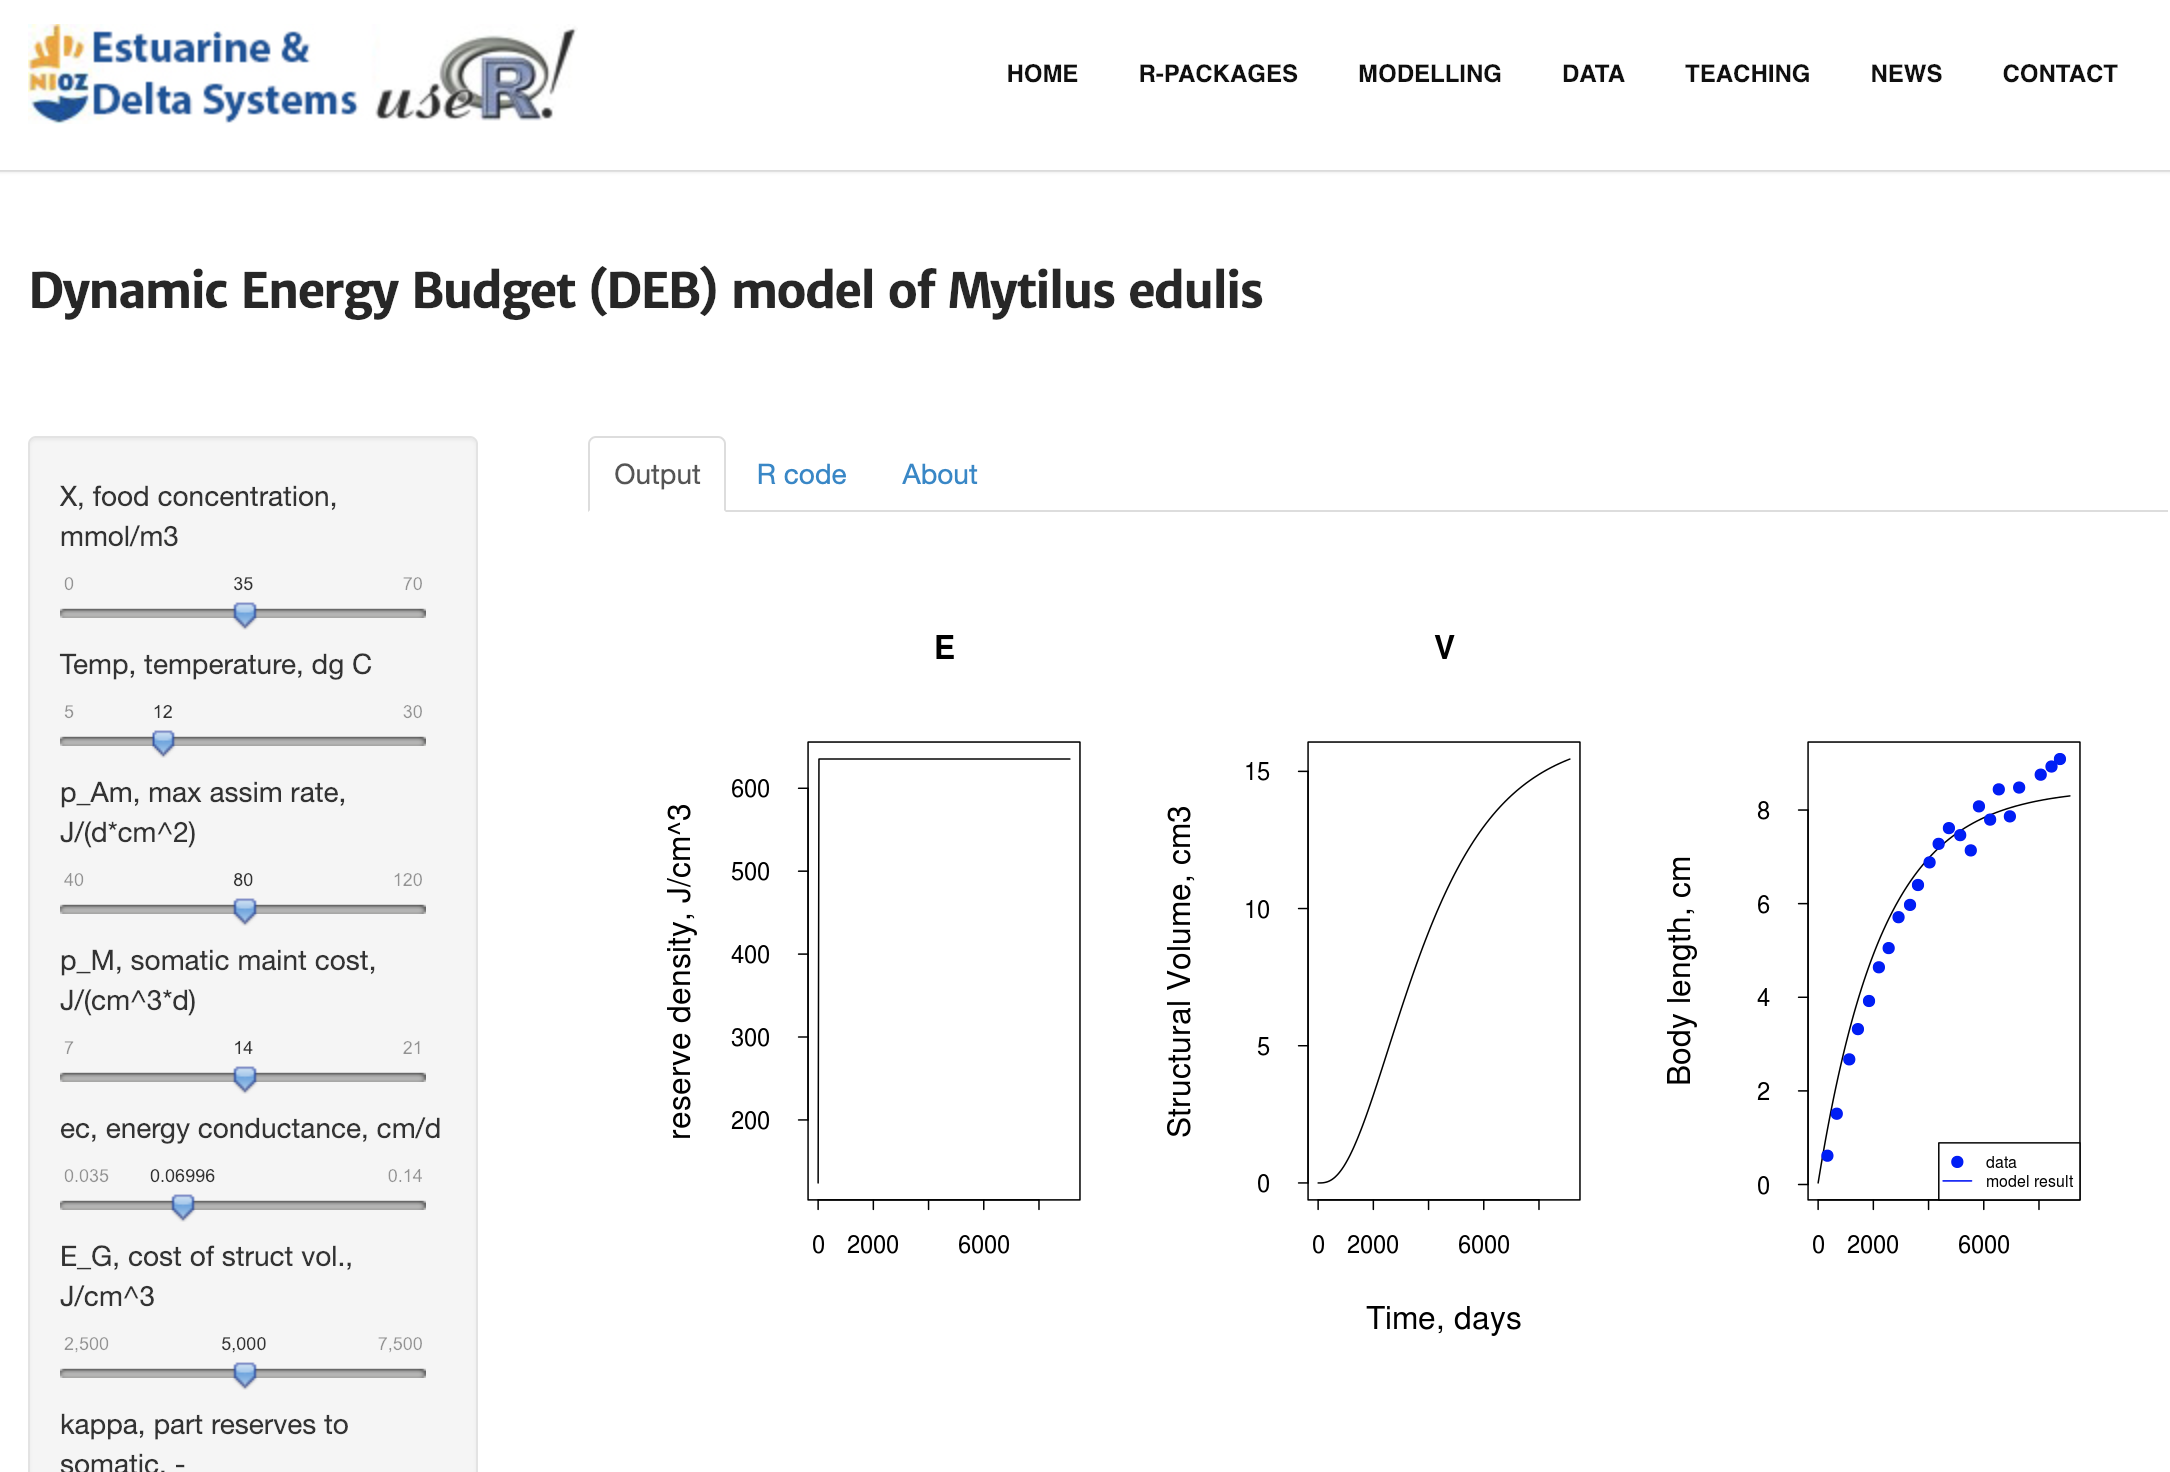
Mussel DEB
The app implements the standard dynamic energy budget (DEB) model simulating the growth of the blue mussel. Specifically, it models how an organism allocates its resources in structural and reserve tissues:
Network topology of deep-sea food webs
Here, you can explore the structure and flow of six deep-sea food webs:
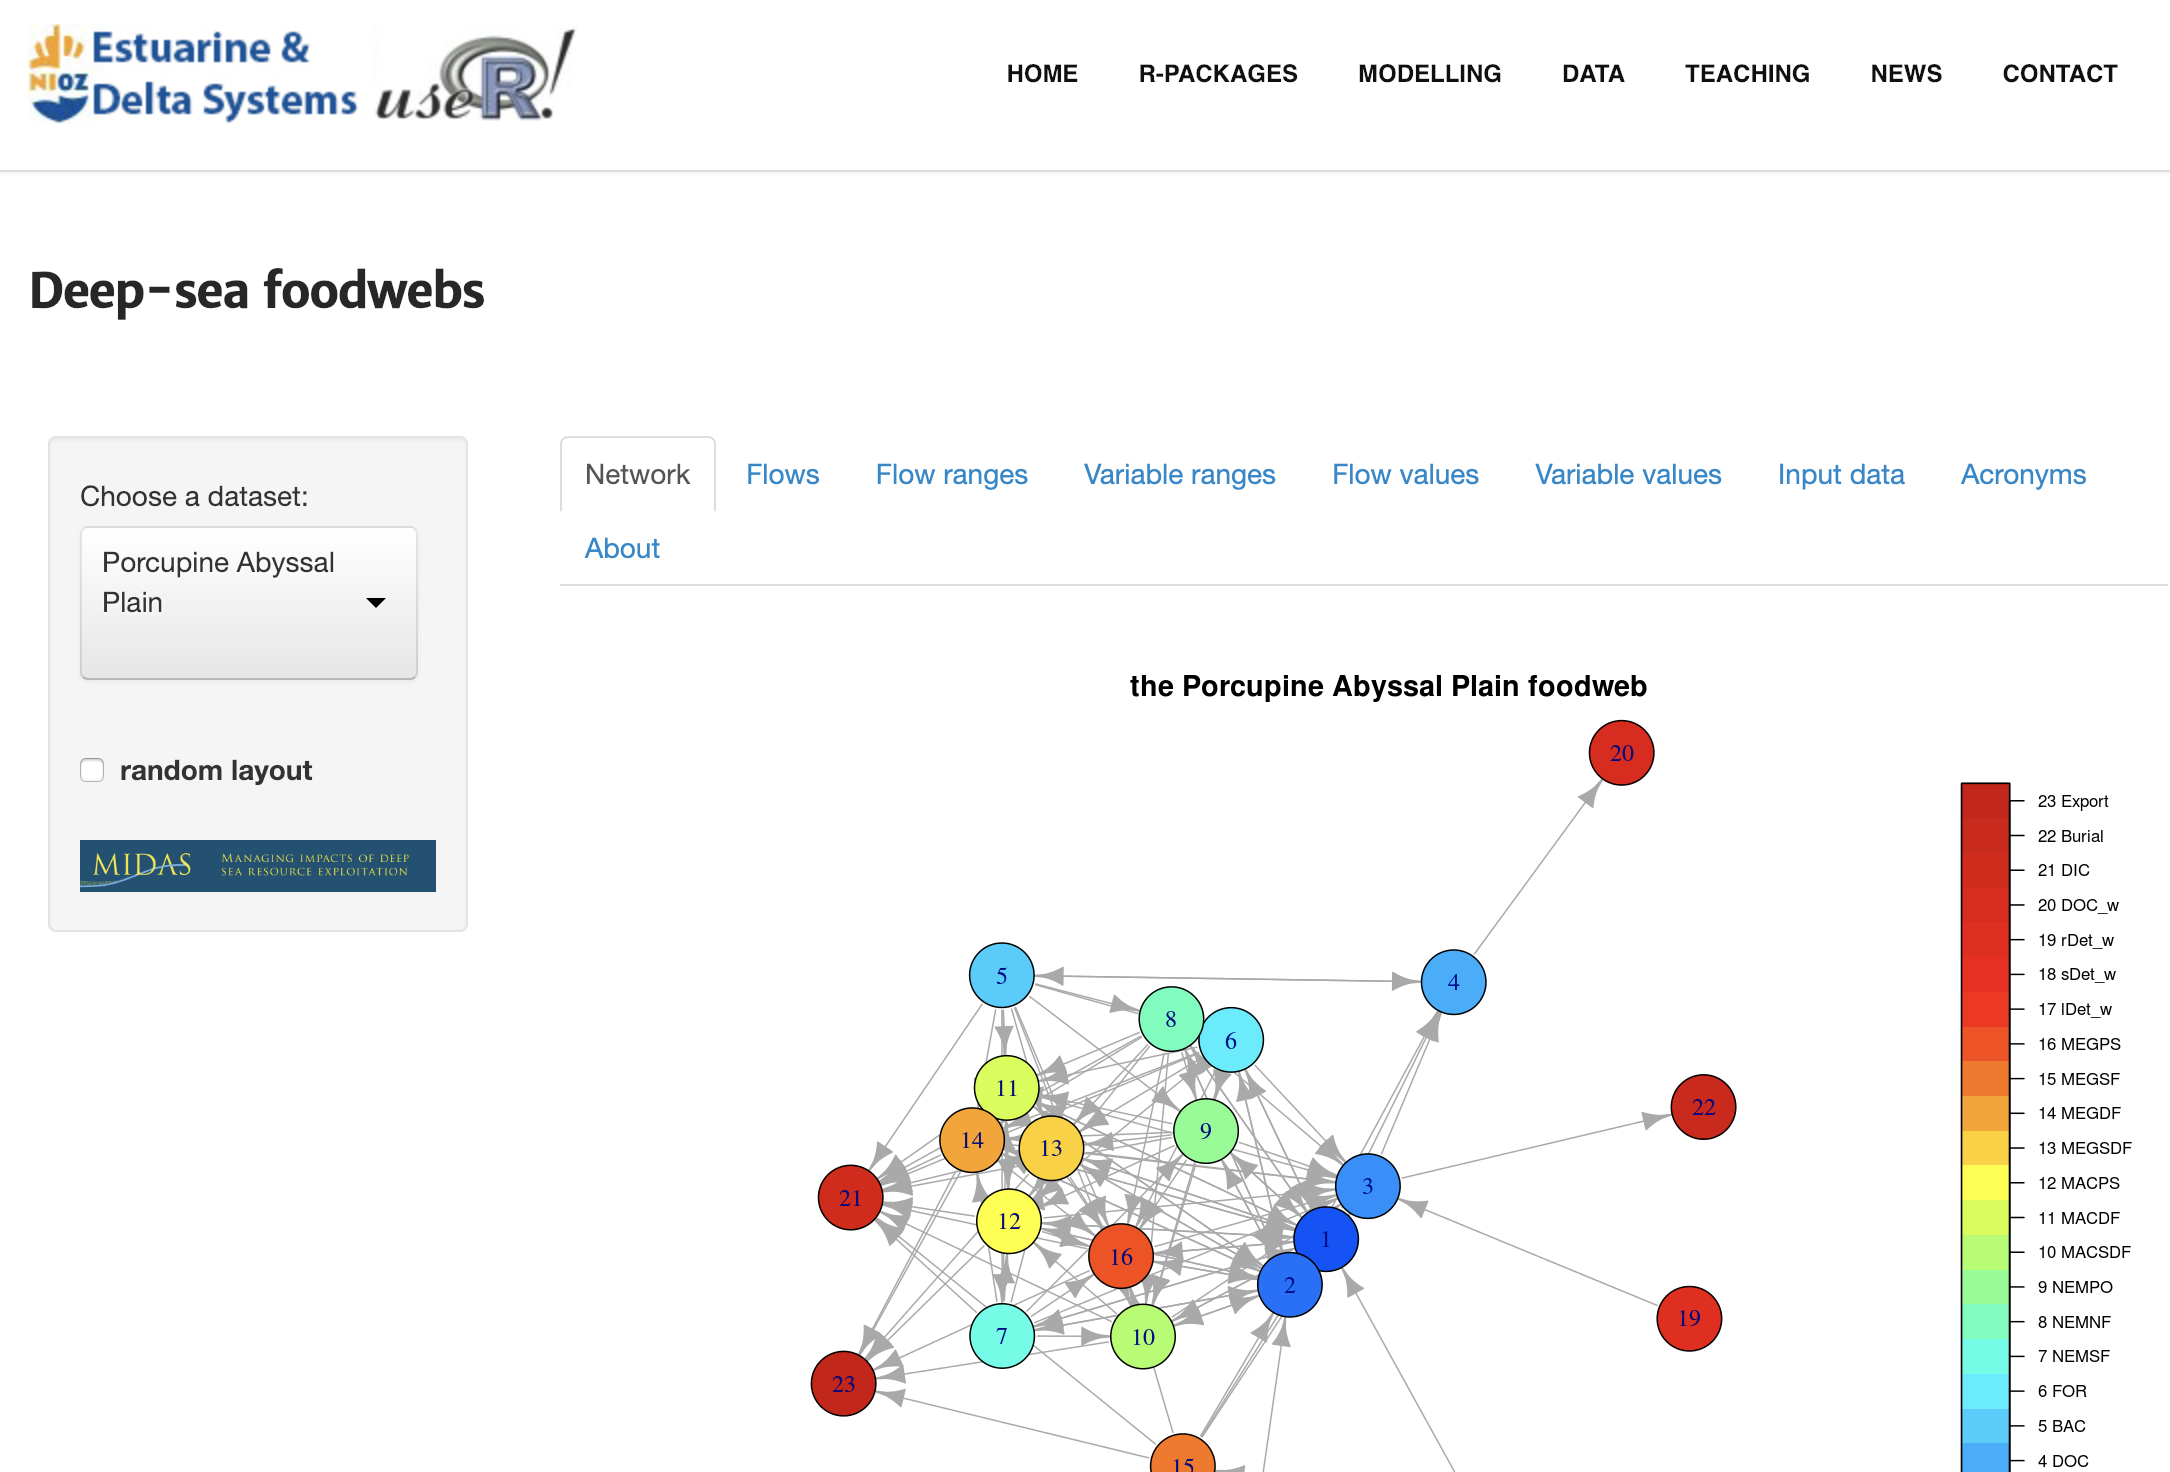
Link: http://www.rforscience.com/modelling/deepseafoodwebs/
Coded by: Karline Soetaert